Conquering Cold Starts: Dynamic Serverless Load Testing
Balancing Cost and Availability in AWS Lambda
Introduction
Serverless architectures, particularly those built on AWS Lambda, offer incredible scalability. But that scalability comes with a notorious trade-off: the "cold start." When load spikes, AWS spins up new Lambda instances. If your code is large or requires heavy initializations (like complex DB connections or loading large libraries), users are left waiting.
Recently, our team faced a classic serverless dilemma. We had a complex AWS Lambda backend serving multiple endpoints. We needed to guarantee high availability and low latency (minimizing cold starts), but we couldn't just keep thousands of instances warm all the time—that would completely defeat the cost-saving purpose of serverless.
To find the "Goldilocks zone" between backend availability and low cost, we needed to optimize our system parameters. But you can't optimize what you can't measure. We needed a highly specific, dynamic load-testing solution.
The Challenge
Our testing requirements were rigorous. We needed to:
- Simulate anywhere from a few hundred to 100,000 concurrent users.
- Replicate complex user flows (e.g., logging in, then hitting various endpoints).
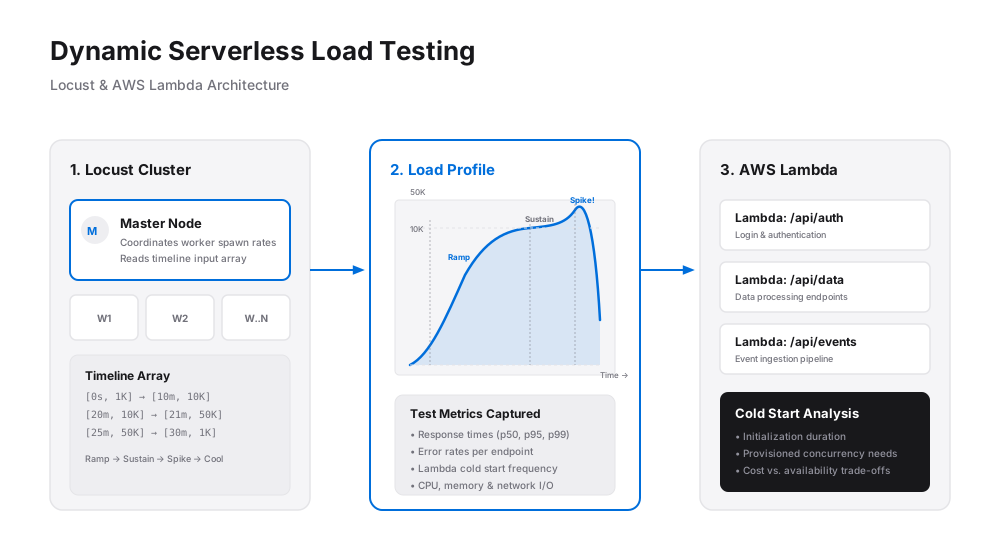
- Generate dynamic load profiles: for example, start at 1k users, ramp up to 10k over 10 minutes, sustain for 10 minutes, and then simulate a viral spike to 50k users in a single minute.
- Track comprehensive metrics: response times, error rates, memory usage, CPU, and network/disk I/O.
Why We Chose Locust
To tackle this, we turned to Locust, an open-source, Python-based load-testing framework.
Locust is brilliant because it lets you define user behavior as Python code. Instead of dealing with clunky UI-based tools, we could write elegant, version-controlled scripts that mimicked our exact user flows. Furthermore, Locust supports distributed testing. By spinning up a Locust "server" (master) to coordinate multiple worker nodes, we could easily generate the massive scale of traffic required to hit 100k users.
Building the Dynamic Load Generator
The trickiest part was the dynamic load requirement. Standard load tests often just ramp up to a target number and stay there. Real-world traffic doesn't act like that.
To solve this, we created a custom Python script within our Locust setup. We fed it a timeline
array consisting of [time_elapsed, target_user_count] pairs. As the test ran,
the Locust master node would continuously read this input and dynamically adjust the spawn
rate of the worker nodes. We could simulate a slow morning, a midday traffic surge, and a
sudden viral spike all in a single test run.
These tests ran anywhere from 30 seconds for quick validations to grueling 5-hour marathons. By the end, our Locust nodes had generated a mountain of JSON data tracking user IDs, endpoints called, response times, and status codes, alongside our internal system logs.
We had the data. The next step? Making sense of it.
(Stay tuned for Part 2, where we dive into how we built a data pipeline using Pandas and Plotly to turn this raw data into actionable engineering decisions.)